Waste Diversion Rate and Waste Characterization
How is the Rate Calculated?
The County of Kauai bases it's Recycling Rate on the amount of material that is diverted from the landfill over the total amount of material that is put into the landfill. This includes both residential and commercial diversion and disposal.
Diversion/Total Waste Generation = Waste Diversion Rate
Mathematics is the art of giving the same name to different things.~ Henri Poincaré
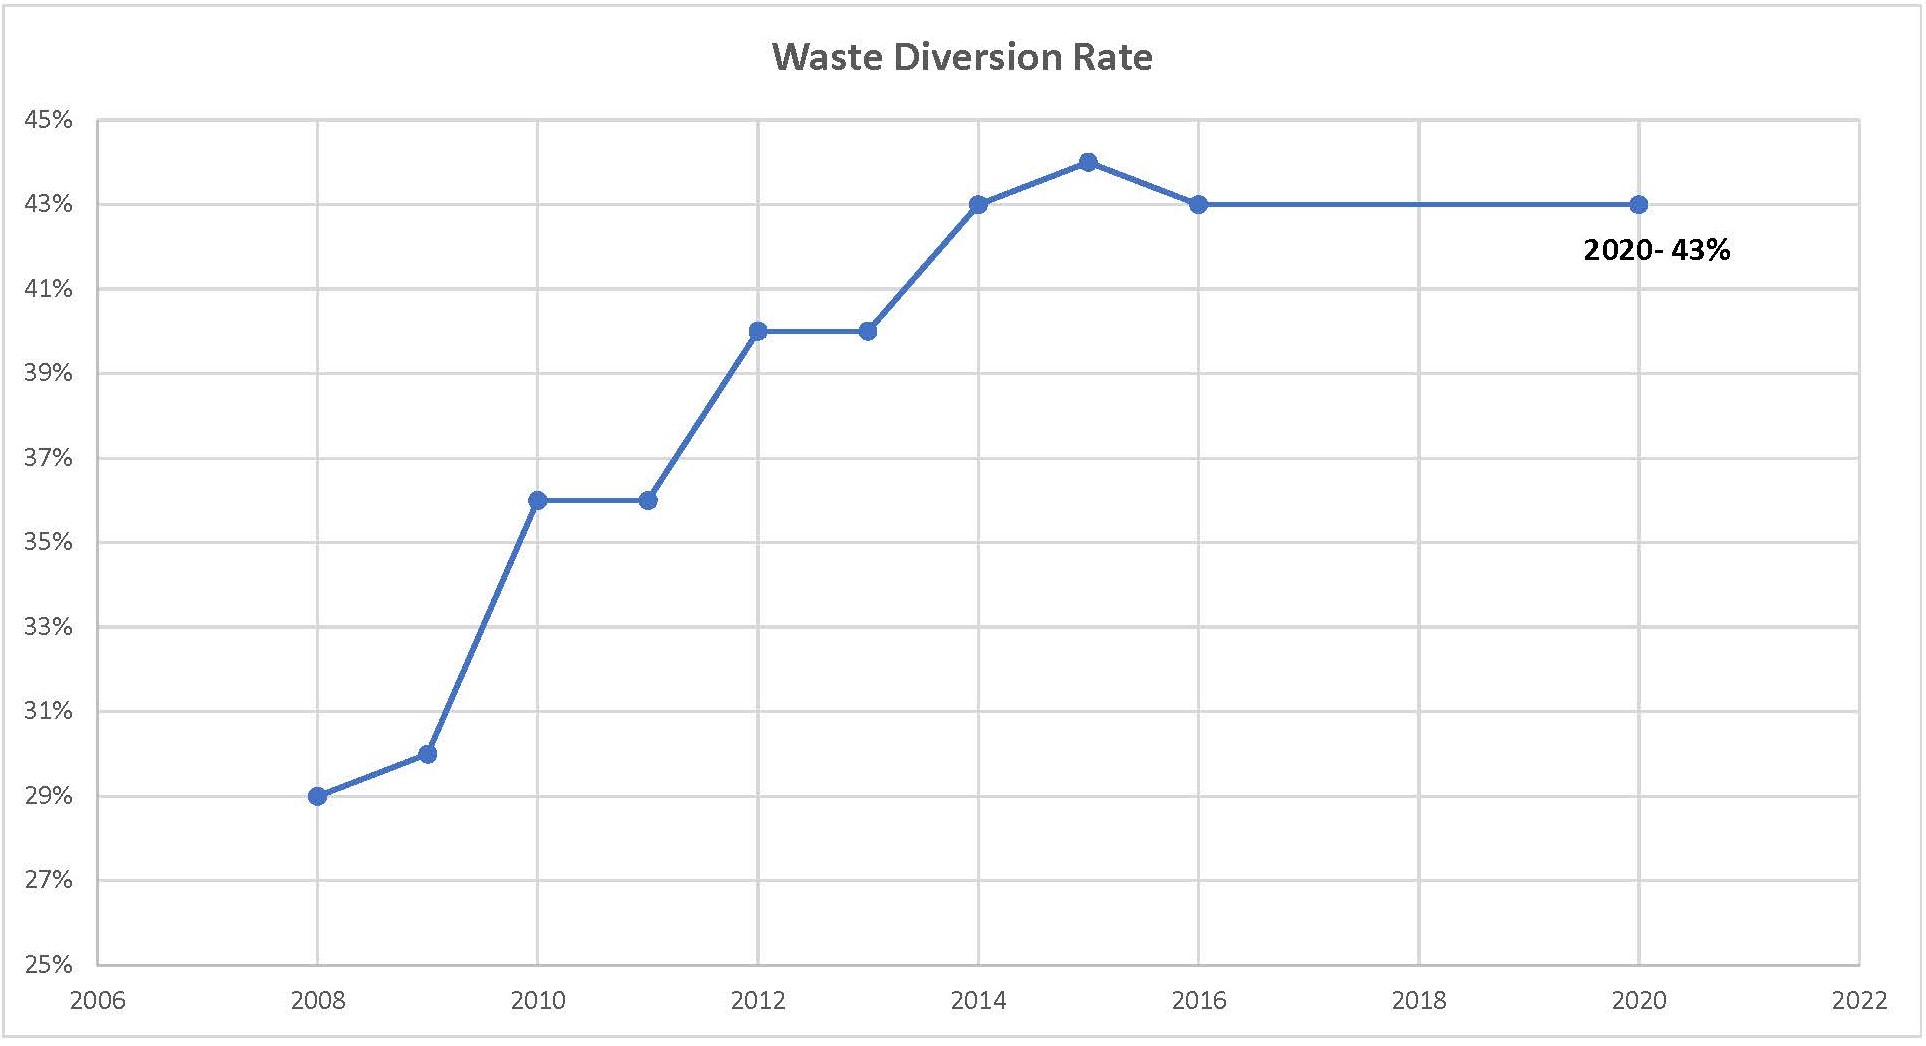
Table of The Waste Diversion Rate
| Fiscal Year |
Recycling Rate |
| 2020 |
43% |
| 2016 |
43% |
| 2015 |
44% |
| 2014 |
43% |
| 2013 |
40% |
| 2012 |
40% |
| 2011 |
36% |
| 2010 |
36% |
| 2009 |
30% |
| 2008 |
29% |
Updated 8/16/21
Graph of Waste Diversion Rate 2008-2020
Updated 1/31/17
2020 Top 10 Diverted Materials Estimated in Tons
Material Tons
- Greenwaste 32,923
- Pig Farmers 11,091
- Cardboard 5,639
- Scrap Metal 4,488
- Concrete/Asphalt (no on-site recycling) 4,267
- Home Composting 1,708
- Pallets- Backhauled to the mainland 1,689
- HI5 Glass 1,280
- Mixed paper 987
- Non-HI5 Glass 777
HI5 is the State's Bottle Deposit Beverage program.
Full breakdown of materials with a comparison between 2020 and 2016 can be downloaded here- 2020/2016 Comparison(PDF, 90KB) .
A breakdown between the County and Commercial waste diversion programs can be found here- 2020 Program Breakdown(PDF, 108KB).
References to scrap metal include processed appliances and automobiles.
Updated 9/14/2022
How does the County calculate tonnage?
The County oversees many recycling contracts, under which contractors perform services and provide monthly reports on the type and quantity of material recycled. We also conduct surveys of companies that divert waste outside of County contracts. Finally the County obtains data from the State Department of Health on annual permit reports of recycling facilities located on Kauai.
Click the PDF to see how the County converts volume reported data to tonnage. Tonnage Conversion Table
County of Kauai Refuse Tonnage and Sources
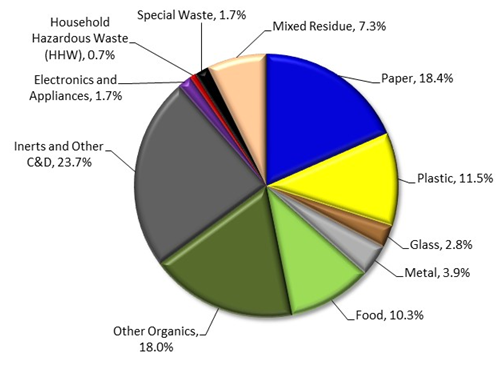
Waste Characterization
A Waste Characterization details the composition of waste deposited at a landfill. In 2016 the County contracted Cascadia Consulting Group to conduct a waste characterization study at Kekaha Landfill. A summary of the results are shown in the pie chart here. Please see the full report for detailed information.
Kekaha Landfill 2016 Waste Characterization
Waste Characterization Report
Click here(PDF, 2MB) for a pdf version of the report.